


New to KubeDB? Please start here.
Monitoring Hazelcast with builtin Prometheus
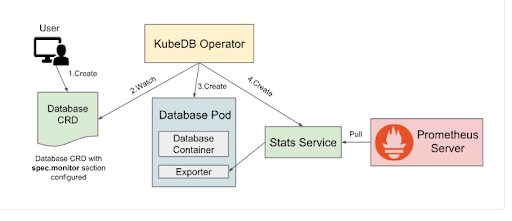
This tutorial will show you how to monitor Hazelcast database using builtin Prometheus scraper.
Before You Begin
At first, you need to have a Kubernetes cluster, and the kubectl command-line tool must be configured to communicate with your cluster. If you do not already have a cluster, you can create one by using kind.
Install KubeDB operator in your cluster following the steps here.
If you are not familiar with how to configure Prometheus to scrape metrics from various Kubernetes resources, please read the tutorial from here.
To learn how Prometheus monitoring works with KubeDB in general, please visit here.
To keep Prometheus resources isolated, we are going to use a separate namespace called
monitoringto deploy respective monitoring resources. We are going to deploy database indemonamespace.$ kubectl create ns monitoring namespace/monitoring created $ kubectl create ns demo namespace/demo created
Note: YAML files used in this tutorial are stored in docs/examples/hazelcast folder in GitHub repository kubedb/docs.
Deploy Hazelcast with Monitoring Enabled
At first, let’s deploy a Hazelcast database with monitoring enabled. Below is the Hazelcast object that we are going to create.
apiVersion: kubedb.com/v1alpha2
kind: Hazelcast
metadata:
  name: builtin-prom-hz
  namespace: demo
spec:
  monitor:
    agent: prometheus.io/builtin
    prometheus:
      serviceMonitor:
        labels:
          release: prometheus
        interval: 10s
  deletionPolicy: Halt
  licenseSecret:
    name: hz-license-key
  replicas: 3
  version: 5.5.2
  storage:
    accessModes:
      - ReadWriteOnce
    resources:
      requests:
        storage: 2Gi
    storageClassName: standard
Here,
spec.monitor.agent: prometheus.io/builtinspecifies that we are going to monitor this server using builtin Prometheus scraper.
Let’s create the Hazelcast crd we have shown above.
$ kubectl apply -f https://github.com/kubedb/docs/raw/v2025.7.31/docs/examples/hazelcast/monitoring/hazelcast-builtin.yaml
hazelcast.kubedb.com/builtin-prom-hz created
Now, wait for the database to go into Running state.
$ kubectl get hz -n demo
NAME              TYPE                  VERSION   STATUS   AGE
builtin-prom-hz   kubedb.com/v1alpha2   5.5.2     Ready    59m
KubeDB will create a separate stats service with name {Hazelcast crd name}-stats for monitoring purpose.
$ kubectl get svc -n demo -l 'app.kubernetes.io/instance=builtin-prom-hz'
NAME                     TYPE        CLUSTER-IP     EXTERNAL-IP   PORT(S)     AGE
builtin-prom-hz          ClusterIP   10.43.10.145   <none>        5701/TCP    39m
builtin-prom-hz-pods     ClusterIP   None           <none>        5701/TCP    39m
builtin-prom-hz-stats    ClusterIP   10.43.234.9    <none>        56790/TCP   39m
Here, builtin-prom-hz-stats service has been created for monitoring purpose. Let’s describe the service.
$ kubectl describe svc -n demo builtin-prom-hz-stats
Name:                     builtin-prom-hz-stats
Namespace:                demo
Labels:                   app.kubernetes.io/component=database
                          app.kubernetes.io/instance=builtin-prom-hz
                          app.kubernetes.io/managed-by=kubedb.com
                          app.kubernetes.io/name=hazelcasts.kubedb.com
                          kubedb.com/role=stats
Annotations:              monitoring.appscode.com/agent: prometheus.io/builtin
                          prometheus.io/path: /metrics
                          prometheus.io/port: 56790
                          prometheus.io/scrape: true
Selector:                 app.kubernetes.io/instance=builtin-prom-hz,app.kubernetes.io/managed-by=kubedb.com,app.kubernetes.io/name=hazelcasts.kubedb.com
Type:                     ClusterIP
IP Family Policy:         SingleStack
IP Families:              IPv4
IP:                       10.43.234.9
IPs:                      10.43.234.9
Port:                     metrics  56790/TCP
TargetPort:               metrics/TCP
Endpoints:                10.42.0.67:56790,10.42.0.68:56790,10.42.0.69:56790
Session Affinity:         None
Internal Traffic Policy:  Cluster
Events:                   <none>
You can see that the service contains following annotations.
prometheus.io/path: /metrics
prometheus.io/port: 56790
prometheus.io/scrape: true
The Prometheus server will discover the service endpoint using these specifications and will scrape metrics from the exporter.
Configure Prometheus Server
Now, we have to configure a Prometheus scraping job to scrape the metrics using this service. We are going to configure scraping job similar to this kubernetes-service-endpoints job that scrapes metrics from endpoints of a service.
Let’s configure a Prometheus scraping job to collect metrics from this service.
- job_name: 'kubedb-databases'
  honor_labels: true
  scheme: http
  kubernetes_sd_configs:
  - role: endpoints
  # by default Prometheus server select all Kubernetes services as possible target.
  # relabel_config is used to filter only desired endpoints
  relabel_configs:
  # keep only those services that has "prometheus.io/scrape","prometheus.io/path" and "prometheus.io/port" anootations
  - source_labels: [__meta_kubernetes_service_annotation_prometheus_io_scrape, __meta_kubernetes_service_annotation_prometheus_io_port]
    separator: ;
    regex: true;(.*)
    action: keep
  # currently KubeDB supported databases uses only "http" scheme to export metrics. so, drop any service that uses "https" scheme.
  - source_labels: [__meta_kubernetes_service_annotation_prometheus_io_scheme]
    action: drop
    regex: https
  # only keep the stats services created by KubeDB for monitoring purpose which has "-stats" suffix
  - source_labels: [__meta_kubernetes_service_name]
    separator: ;
    regex: (.*-stats)
    action: keep
  # service created by KubeDB will have "app.kubernetes.io/name" and "app.kubernetes.io/instance" annotations. keep only those services that have these annotations.
  - source_labels: [__meta_kubernetes_service_label_app_kubernetes_io_name]
    separator: ;
    regex: (.*)
    action: keep
  # read the metric path from "prometheus.io/path: <path>" annotation
  - source_labels: [__meta_kubernetes_service_annotation_prometheus_io_path]
    action: replace
    target_label: __metrics_path__
    regex: (.+)
  # read the port from "prometheus.io/port: <port>" annotation and update scraping address accordingly
  - source_labels: [__address__, __meta_kubernetes_service_annotation_prometheus_io_port]
    action: replace
    target_label: __address__
    regex: ([^:]+)(?::\d+)?;(\d+)
    replacement: $1:$2
  # add service namespace as label to the scraped metrics
  - source_labels: [__meta_kubernetes_namespace]
    separator: ;
    regex: (.*)
    target_label: namespace
    replacement: $1
    action: replace
  # add service name as a label to the scraped metrics
  - source_labels: [__meta_kubernetes_service_name]
    separator: ;
    regex: (.*)
    target_label: service
    replacement: $1
    action: replace
  # add stats service's labels to the scraped metrics
  - action: labelmap
    regex: __meta_kubernetes_service_label_(.+)
Configure Existing Prometheus Server
If you already have a Prometheus server running, you have to add above scraping job in the ConfigMap used to configure the Prometheus server. Then, you have to restart it for the updated configuration to take effect.
If you don’t use a persistent volume for Prometheus storage, you will lose your previously scraped data on restart.
Deploy New Prometheus Server
If you don’t have any existing Prometheus server running, you have to deploy one. In this section, we are going to deploy a Prometheus server in monitoring namespace to collect metrics using this stats service.
Create ConfigMap:
At first, create a ConfigMap with the scraping configuration. Bellow, the YAML of ConfigMap that we are going to create in this tutorial.
apiVersion: v1
kind: ConfigMap
metadata:
  name: prometheus-config
  labels:
    app: prometheus-demo
  namespace: monitoring
data:
  prometheus.yml: |-
    global:
      scrape_interval: 5s
      evaluation_interval: 5s
    scrape_configs:
    - job_name: 'kubedb-databases'
      honor_labels: true
      scheme: http
      kubernetes_sd_configs:
      - role: endpoints
      # by default Prometheus server select all Kubernetes services as possible target.
      # relabel_config is used to filter only desired endpoints
      relabel_configs:
      # keep only those services that has "prometheus.io/scrape","prometheus.io/path" and "prometheus.io/port" anootations
      - source_labels: [__meta_kubernetes_service_annotation_prometheus_io_scrape, __meta_kubernetes_service_annotation_prometheus_io_port]
        separator: ;
        regex: true;(.*)
        action: keep
      # currently KubeDB supported databases uses only "http" scheme to export metrics. so, drop any service that uses "https" scheme.
      - source_labels: [__meta_kubernetes_service_annotation_prometheus_io_scheme]
        action: drop
        regex: https
      # only keep the stats services created by KubeDB for monitoring purpose which has "-stats" suffix
      - source_labels: [__meta_kubernetes_service_name]
        separator: ;
        regex: (.*-stats)
        action: keep
      # service created by KubeDB will have "app.kubernetes.io/name" and "app.kubernetes.io/instance" annotations. keep only those services that have these annotations.
      - source_labels: [__meta_kubernetes_service_label_app_kubernetes_io_name]
        separator: ;
        regex: (.*)
        action: keep
      # read the metric path from "prometheus.io/path: <path>" annotation
      - source_labels: [__meta_kubernetes_service_annotation_prometheus_io_path]
        action: replace
        target_label: __metrics_path__
        regex: (.+)
      # read the port from "prometheus.io/port: <port>" annotation and update scraping address accordingly
      - source_labels: [__address__, __meta_kubernetes_service_annotation_prometheus_io_port]
        action: replace
        target_label: __address__
        regex: ([^:]+)(?::\d+)?;(\d+)
        replacement: $1:$2
      # add service namespace as label to the scraped metrics
      - source_labels: [__meta_kubernetes_namespace]
        separator: ;
        regex: (.*)
        target_label: namespace
        replacement: $1
        action: replace
      # add service name as a label to the scraped metrics
      - source_labels: [__meta_kubernetes_service_name]
        separator: ;
        regex: (.*)
        target_label: service
        replacement: $1
        action: replace
      # add stats service's labels to the scraped metrics
      - action: labelmap
        regex: __meta_kubernetes_service_label_(.+)
Let’s create above ConfigMap,
$ kubectl apply -f https://github.com/kubedb/docs/raw/v2025.7.31/docs/examples/monitoring/builtin-prometheus/prom-config.yaml
configmap/prometheus-config created
Create RBAC:
If you are using an RBAC enabled cluster, you have to give necessary RBAC permissions for Prometheus. Let’s create necessary RBAC stuffs for Prometheus,
$ kubectl apply -f https://github.com/appscode/third-party-tools/raw/master/monitoring/prometheus/builtin/artifacts/rbac.yaml
clusterrole.rbac.authorization.k8s.io/prometheus created
serviceaccount/prometheus created
clusterrolebinding.rbac.authorization.k8s.io/prometheus created
YAML for the RBAC resources created above can be found here.
Deploy Prometheus:
Now, we are ready to deploy Prometheus server. We are going to use following deployment to deploy Prometheus server.
Let’s deploy the Prometheus server.
$ kubectl apply -f https://github.com/appscode/third-party-tools/raw/master/monitoring/prometheus/builtin/artifacts/deployment.yaml
deployment.apps/prometheus created
Verify Monitoring Metrics
Prometheus server is listening to port 9090. We are going to use port forwarding to access Prometheus dashboard.
At first, let’s check if the Prometheus pod is in Running state.
$ kubectl get pod -n monitoring -l=app=prometheus
NAME                         READY   STATUS    RESTARTS   AGE
prometheus-7479654b9-bwx8f   1/1     Running   0          60m
Now, run following command on a separate terminal to forward 9090 port of prometheus-7479654b9-bwx8f pod,
$ kubectl port-forward -n monitoring prometheus-7479654b9-bwx8f 9090
Forwarding from 127.0.0.1:9090 -> 9090
Forwarding from [::1]:9090 -> 9090
Now, we can access the dashboard at localhost:9090. Open http://localhost:9090 in your browser. You should see the endpoint of builtin-prom-hz-stats service as one of the targets.
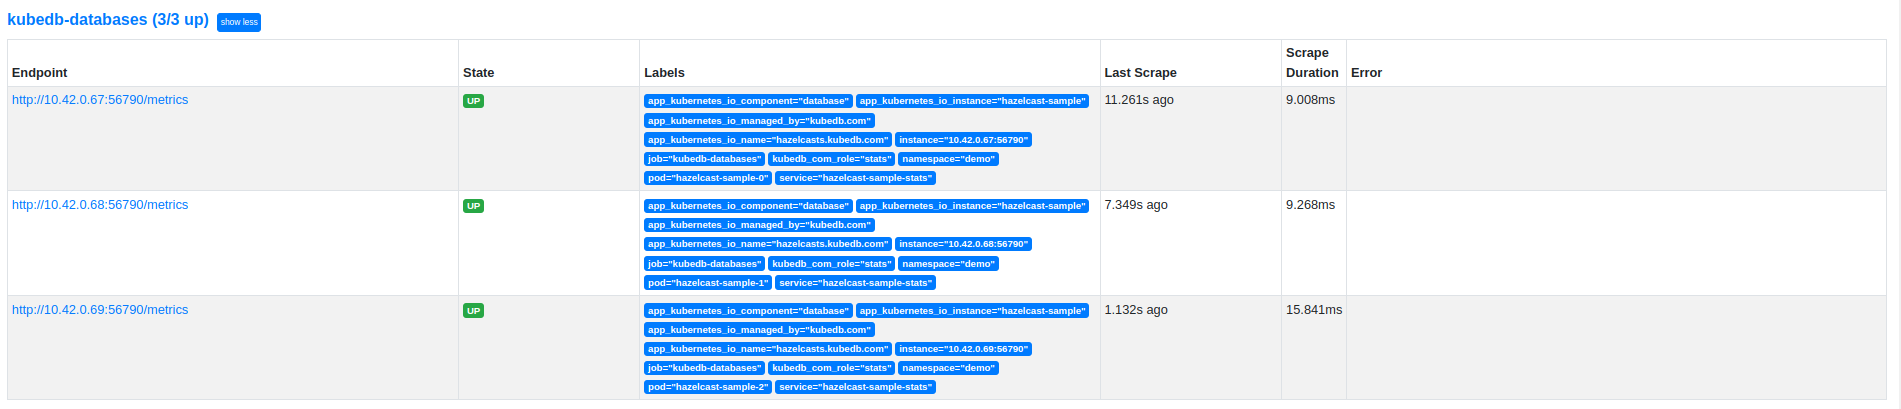
Check the labels in image. These labels confirm that the metrics are coming from Hazelcast database builtin-prom-hz through stats service builtin-prom-hz-stats.
Now, you can view the collected metrics and create a graph from homepage of this Prometheus dashboard. You can also use this Prometheus server as data source for Grafana and create beautiful dashboard with collected metrics.
Cleaning up
To cleanup the Kubernetes resources created by this tutorial, run following commands
$ kubectl delete -n demo es/builtin-prom-es

$ kubectl delete -n monitoring deployment.apps/prometheus

$ kubectl delete -n monitoring clusterrole.rbac.authorization.k8s.io/prometheus
$ kubectl delete -n monitoring serviceaccount/prometheus
$ kubectl delete -n monitoring clusterrolebinding.rbac.authorization.k8s.io/prometheus

$ kubectl delete ns demo
$ kubectl delete ns monitoring